• Skip to main content
  • Skip to primary sidebar

学習記録

時系列データのグラフ

2017年12月20日 by 河副 太智 Leave a Comment

[1,5,3,5,3,2,2,9]という時系列データの階差系列は[4,-2,2,-2,-1,0,7]となる

1
2
3
4
5
6
7
8
9
10
11
12
13
14
15
16
17
18
19
20
21
22
23
24
25
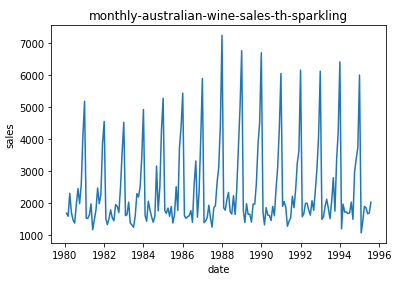
import numpy as np
import pandas as pd
import matplotlib.pyplot as plt
import statsmodels.api as sm
from pandas import datetime
%matplotlib inline
 
 
# データ読み込む
sales_sparkring = pd.read_csv(filepath_or_buffer = 'https://aidemyexcontentsdata.blob.core.windows.net/data/5060_tsa/monthly-australian-wine-sales-th-sparkling.csv')
# データの時期を入力 Mは間隔
index = pd.date_range('1980-11-31','1995-11-31',freq = 'M')
# インデックスデータをdfのインデックスに設定
sales_sparkring.index = index
# カラムの削除
del sales_sparkring['Month']
 
# グラフのタイトル設定
plt.title("monthly-australian-wine-sales-th-sparkling")
# x軸とy軸名前設定
plt.xlabel("date")
plt.ylabel("sales")
 
plt.plot(sales_sparkring)
plt.show()


このエントリーをはてなブックマークに追加

Tweet
[`yahoo` not found]
このエントリーを Google ブックマーク に追加
LinkedIn にシェア
LINEで送る


Filed Under: 時系列分析

Reader Interactions

コメントを残す コメントをキャンセル

メールアドレスが公開されることはありません。 ※ が付いている欄は必須項目です

Primary Sidebar

カテゴリー

  • AWS
  • Bootstrap
  • Dash
  • Django
  • flask
  • GIT(sourcetree)
  • Plotly/Dash
  • VPS
  • その他tool
  • ブログ
  • プログラミング
    • Bokeh
    • css
    • HoloViews
    • Jupyter
    • Numpy
    • Pandas
    • PosgreSQL
    • Python 基本
    • python3
      • webアプリ
    • python3解説
    • scikit-learn
    • scipy
    • vps
    • Wordpress
    • グラフ
    • コマンド
    • スクレイピング
    • チートシート
    • データクレンジング
    • ブロックチェーン
    • 作成実績
    • 時系列分析
    • 機械学習
      • 分析手法
      • 教師有り
    • 異常値検知
    • 自然言語処理
  • 一太郎
  • 数学
    • sympy
      • 対数関数(log)
      • 累乗根(n乗根)
    • 暗号学

Copyright © 2025 · Genesis Sample on Genesis Framework · WordPress · Log in