|
1 2 3 4 5 6 7 8 9 10 11 |
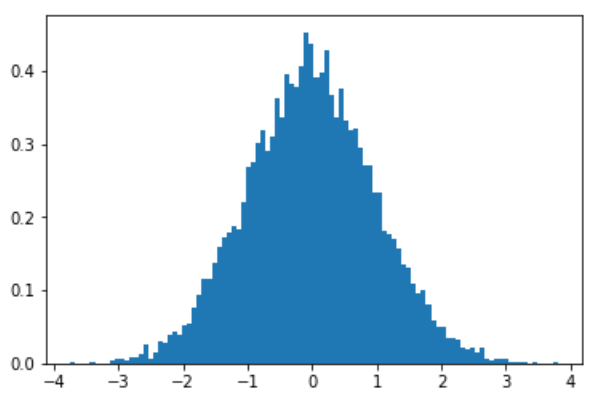
import numpy as np import matplotlib.pyplot as plt %matplotlib inline np.random.seed(0) data = np.random.randn(10000) # 正規化されたビン数100のヒストグラムを作成 plt.hist(data, bins=100, normed=True) plt.show() |

bins=xで任意の数の階級に分け、autoはランダム
normedは正規化
cumulativeは累積ヒストグラム
コメントを残す