|
1 2 3 4 5 6 7 8 9 10 11 12 13 14 15 16 17 18 19 20 21 22 23 24 25 26 27 28 29 30 31 32 33 34 35 36 37 38 39 40 41 42 43 44 45 |
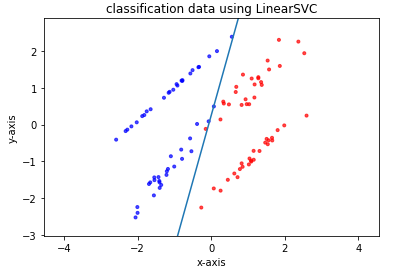
# パッケージをインポート import numpy as np import matplotlib import matplotlib.pyplot as plt from sklearn.svm import LinearSVC from sklearn.model_selection import train_test_split from sklearn.datasets import make_classification # ページ上で直接グラフが見られるようにするおまじない %matplotlib inline # データの生成 X, y = make_classification(n_samples=100, n_features=2, n_redundant=0, random_state=42) train_X, test_X, train_y, test_y = train_test_split(X, y, random_state=42) # 以下にコードを記述してください # モデルの構築 model = LinearSVC(random_state=42) # train_Xとtrain_yを使ってモデルに学習させる model.fit(train_X, train_y) # test_Xとtest_yを用いたモデルの正解率を出力 print(model.score(test_X, test_y)) # 生成したデータをプロット plt.scatter(X[:, 0], X[:, 1], c=y, marker='.', cmap=matplotlib.cm.get_cmap(name='bwr'), alpha=0.7) # 学習して導出した識別境界線をプロット Xi = np.linspace(-10, 10) Y = -model.coef_[0][0] / model.coef_[0][1] * Xi - model.intercept_ / model.coef_[0][1] plt.plot(Xi, Y) # グラフのスケールを調整 plt.xlim(min(X[:, 0]) - 0.5, max(X[:, 0]) + 0.5) plt.ylim(min(X[:, 1]) - 0.5, max(X[:, 1]) + 0.5) plt.axes().set_aspect('equal', 'datalim') # グラフにタイトルを設定する plt.title("classification data using LinearSVC") # x軸、y軸それぞれに名前を設定する plt.xlabel("x-axis") plt.ylabel("y-axis") plt.show() |
コメントを残す