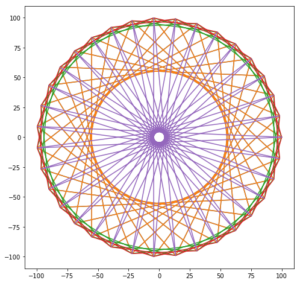
• Skip to main content
  • Skip to primary sidebar

学習記録

プログラミング

曼荼羅の壁画

2018年4月22日 by 河副 太智 Leave a Comment

1.母ピンの本数
2.角度
3.リストの素数

によって曼荼羅模様が変わるプログラム

1
2
3
4
5
6
7
8
9
10
11
12
13
14
15
16
17
18
19
20
21
22
23
24
25
26
27
28
29
%matplotlib inline
 
 
import matplotlib.pyplot as plt
import math
 
n = 35#母ピンの本数
 
kaku = 360 / n #角度
 
 
x = [] #ピンの位皿
y = [] #ピンの位皿
 
 
pnum = [11,81,101, 3, 17 ] # (1)素数のリスト
 
#索数番目のピンに糸をかける
 
plt.figure(figsize=(8, 8))
for p in pnum:
    for i in range(n+1):
        th = math.radians(kaku*i*p)
        x.append(100 * math.cos(th))
        y.append(100 * math.sin(th))
    plt.plot(x,y)#模様を壁画
    x.clear() # をクリア
    y.clear() #
plt. show()

Filed Under: グラフ

Blockchainプログラミング基礎:listの使い方

2018年4月21日 by 河副 太智 Leave a Comment

PythonでのBlockchainプログラミングの初歩はlistの使い方です。

1
2
3
4
#変数blockchainに4つの数値をlist形式で渡す。
>>> blockchain =[1,5,7,809]
>>> blockchain
[1, 5, 7, 809]


1
2
3
#変数blockchainのlist内の左から3番目の数値を取得
>>> blockchain[2]
7


1
2
3
#変数blockchainのlist内の左から3番目の数値を2倍にする
>>> blockchain[2]*2
14

↑このlistの特定の数値を2倍にするのはlistの中身を変更するわけではなく
一次的に2倍にされた数値が表示されているだけですので
再度変数blockchainを表示させれば2倍になる前の数値が出てきます。


1
2
3
4
5
6
#listに値を追加する場合はappend()を使用数値3をlist末尾に追加します。
>>> blockchain
[1, 5, 7, 809]
>>> blockchain.append(3)
>>> blockchain
[1, 5, 7, 809, 3]


1
2
3
4
5
6
#listの末尾を削除するにはpopを使用
 
>>> blockchain.pop()
3
>>> blockchain
[1, 5, 7, 809]

↑この方法ですと一次的ではなくlistから値が削除されるので
次回変数blockchainを呼び出せば末尾の3は除外されたlistが
表示される事になります。

Filed Under: ブロックチェーン Tagged With: ブロックチェーン

周期表をbokehでhtml出力

2018年4月18日 by 河副 太智 Leave a Comment

1
2
3
4
5
6
7
8
9
10
11
12
13
14
15
16
17
18
19
20
21
22
23
24
25
26
27
28
29
30
31
32
33
34
35
36
37
38
39
40
41
42
43
44
45
46
47
48
49
50
51
52
53
54
55
56
57
58
59
60
61
62
63
64
65
66
67
68
69
70
71
72
73
74
75
from bokeh.io import output_file, show
from bokeh.models import ColumnDataSource, HoverTool
from bokeh.plotting import figure
from bokeh.sampledata.periodic_table import elements
from bokeh.transform import dodge, factor_cmap
 
output_file("period.html")
 
periods = ["I", "II", "III", "IV", "V", "VI", "VII"]
groups = [str(x) for x in range(1, 19)]
 
df = elements.copy()
df["atomic mass"] = df["atomic mass"].astype(str)
df["group"] = df["group"].astype(str)
df["period"] = [periods[x-1] for x in df.period]
df = df[df.group != "-"]
df = df[df.symbol != "Lr"]
df = df[df.symbol != "Lu"]
 
cmap = {
    "alkali metal"         : "#a6cee3",
    "alkaline earth metal" : "#1f78b4",
    "metal"                : "#d93b43",
    "halogen"              : "#999d9a",
    "metalloid"            : "#e08d49",
    "noble gas"            : "#eaeaea",
    "nonmetal"             : "#f1d4Af",
    "transition metal"     : "#599d7A",
}
 
source = ColumnDataSource(df)
 
p = figure(title="Periodic Table (omitting LA and AC Series)", plot_width=1000, plot_height=450,
           tools="", toolbar_location=None,
           x_range=groups, y_range=list(reversed(periods)))
 
p.rect("group", "period", 0.95, 0.95, source=source, fill_alpha=0.6, legend="metal",
       color=factor_cmap('metal', palette=list(cmap.values()), factors=list(cmap.keys())))
 
text_props = {"source": source, "text_align": "left", "text_baseline": "middle"}
 
x = dodge("group", -0.4, range=p.x_range)
 
r = p.text(x=x, y="period", text="symbol", **text_props)
r.glyph.text_font_style="bold"
 
r = p.text(x=x, y=dodge("period", 0.3, range=p.y_range), text="atomic number", **text_props)
r.glyph.text_font_size="8pt"
 
r = p.text(x=x, y=dodge("period", -0.35, range=p.y_range), text="name", **text_props)
r.glyph.text_font_size="5pt"
 
r = p.text(x=x, y=dodge("period", -0.2, range=p.y_range), text="atomic mass", **text_props)
r.glyph.text_font_size="5pt"
 
p.text(x=["3", "3"], y=["VI", "VII"], text=["LA", "AC"], text_align="center", text_baseline="middle")
 
p.add_tools(HoverTool(tooltips = [
    ("Name", "@name"),
    ("Atomic number", "@{atomic number}"),
    ("Atomic mass", "@{atomic mass}"),
    ("Type", "@metal"),
    ("CPK color", "$color[hex, swatch]:CPK"),
    ("Electronic configuration", "@{electronic configuration}"),
]))
 
p.outline_line_color = None
p.grid.grid_line_color = None
p.axis.axis_line_color = None
p.axis.major_tick_line_color = None
p.axis.major_label_standoff = 0
p.legend.orientation = "horizontal"
p.legend.location ="top_center"
 
show(p)


Filed Under: Bokeh, グラフ Tagged With: Bokeh

from PIL import Imageから出てくるエラー文 ”Pillow or PIL”

2018年4月14日 by 河副 太智 Leave a Comment

from PIL import Imageから出てくるエラー文
ImportError: The _imaging extension was built for another version of Pillow or PIL
で長時間引っかかった

調べてみるとpython 3.6 自体に問題があるようで
C:\Anaconda\lib\site-packages\PIL\Image.pyの

1
2
3
if PILLOW_VERSION != getattr(core, 'PILLOW_VERSION', None):
raise ImportError("The _imaging extension was built for another " "
version of Pillow or PIL")

の部分を

1
2
3
if <strong><span style="color: #ff0000;">core.</span></strong>PILLOW_VERSION != getattr(core, 'PILLOW_VERSION', None):
raise ImportError("The _imaging extension was built for another " "
version of Pillow or PIL")

に変更したら直りました。

Filed Under: python3 Tagged With: PIL, Pillow, The _imaging extension was built for another version of Pillow or PIL

Bokehで動かせるグラフを作成

2018年4月10日 by 河副 太智 Leave a Comment

Bokehはインタラクティブなグラフを作成できるデータ可視化ライブラリです。


インストール

インストール方法Anadonda使用

1
conda install bokeh

pipの場合

1
pip install bokeh

詳細は、公式ドキュメントを御覧下さい。


更に容量の大きなサンプルデータをダウンロード

1
$bokeh sampledata

あるいは、Pythonのインタープリタ上でもダウンロード可能

1
2
import bokeh.sampledata
bokeh.sampledata.download()


テスト

Jupyter notebookで実行 ※現時点ではJupyter labでは使用不可

1
2
3
4
from bokeh.io import output_notebook
from bokeh.io import show
output_notebook()

BokehJS 0.12.15 successfully loaded.と出ればOK


スライダー

次にスライダーの設定をしますIpywidgetsをインポート

pip

1
2
pip install ipywidgets
jupyter nbextension enable --py widgetsnbextension

conda

1
conda install -c conda-forge ipywidgets


コード

1
2
3
from ipywidgets import IntSlider
slider = IntSlider(value=50)#valueの値は可変
slider


bokehスライダー


これでJupyter上でスライダーが動きます

この状態では中心が50となりスライダーを右端に移動させると
100になります。

画面上でvalueを変更する以外にも以下のように記述すれば
スライダーの位置の変更が可能です。

1
slider.value = 100


手動でsliderを移動させた場合

1
slider.value

逆にスライダーの位置の値を取得する事も可能


HTMLでリアルタイム表示

1
2
3
4
from ipywidgets import HTML
 
text = HTML("スライダーの値は{}".format(slider.value))
text

スライダーの値は50と表示されます


http://harmonizedai.com/article/wp-content/uploads/2018/04/bokenhtml.mp4


bqplot(二次元プロット)

bqplotドキュメント


pip

1
2
pip install bqplot
jupyter nbextension enable --py --sys-prefix bqplot

conda

1
conda install -c conda-forge bqplot


Filed Under: グラフ

プログラミング作業休憩タイマー

2018年4月10日 by 河副 太智 Leave a Comment

プログラミングをやりすぎると首、肩がこってパフォーマンスが最悪になるので
一定時間経つと音を鳴らして、その間に目を閉じてリラックスするようにした

10分作業したら休憩開始の音
2分休憩したら作業開始の音

これを10回繰り返したらタイマー終了

1
2
3
4
5
6
7
8
9
10
11
12
import winsound as ws
from time import sleep
 
a = 0
while a < 10:
    sleep(600)
    ws.Beep(523, 500)
    sleep(120)
    ws.PlaySound( 'SystemAsterisk', ws.SND_ALIAS )
    a += 1
    
ws.PlaySound( 'SystemExclamation', ws.SND_ALIAS )

作業音の種類はこちらを参照させていただきました

Filed Under: python3

  • « Go to Previous Page
  • Page 1
  • Interim pages omitted …
  • Page 11
  • Page 12
  • Page 13
  • Page 14
  • Page 15
  • Interim pages omitted …
  • Page 55
  • Go to Next Page »

Primary Sidebar

カテゴリー

  • AWS
  • Bootstrap
  • Dash
  • Django
  • flask
  • GIT(sourcetree)
  • Plotly/Dash
  • VPS
  • その他tool
  • ブログ
  • プログラミング
    • Bokeh
    • css
    • HoloViews
    • Jupyter
    • Numpy
    • Pandas
    • PosgreSQL
    • Python 基本
    • python3
      • webアプリ
    • python3解説
    • scikit-learn
    • scipy
    • vps
    • Wordpress
    • グラフ
    • コマンド
    • スクレイピング
    • チートシート
    • データクレンジング
    • ブロックチェーン
    • 作成実績
    • 時系列分析
    • 機械学習
      • 分析手法
      • 教師有り
    • 異常値検知
    • 自然言語処理
  • 一太郎
  • 数学
    • sympy
      • 対数関数(log)
      • 累乗根(n乗根)
    • 暗号学

Copyright © 2025 · Genesis Sample on Genesis Framework · WordPress · Log in