• Skip to main content
  • Skip to primary sidebar

学習記録

プログラミング

ランダムフォレスト

2017年12月13日 by 河副 太智 Leave a Comment


1
2
3
4
5
6
7
8
9
10
11
12
13
14
15
16
17
18
19
20
21
22
23
24
25
26
27
28
29
30
31
32
33
34
35
36
37
38
39
40
41
42
43
44
45
46
47
48
49
50
51
52
53
54
# きのこデータの取得
# 必要なパッケージをインポート
import requests
import zipfile
from io import StringIO
import io
import pandas as pd
# データの前処理に必要なパッケージのインポート
from sklearn.model_selection import train_test_split
from sklearn import preprocessing
 
# url
mush_data_url = "http://archive.ics.uci.edu/ml/machine-learning-databases/mushroom/agaricus-lepiota.data"
s = requests.get(mush_data_url).content
 
# データの形式変換
mush_data = pd.read_csv(io.StringIO(s.decode('utf-8')), header=None)
 
# データに名前をつける(データを扱いやすくするため)
mush_data.columns = ["classes", "cap_shape", "cap_surface", "cap_color", "odor", "bruises",
                     "gill_attachment", "gill_spacing", "gill_size", "gill_color", "stalk_shape",
                     "stalk_root", "stalk_surface_above_ring", "stalk_surface_below_ring",
                     "stalk_color_above_ring", "stalk_color_below_ring", "veil_type", "veil_color",
                     "ring_number", "ring_type", "spore_print_color", "population", "habitat"]
 
# カテゴリー変数(色の種類など数字の大小が決められないもの)をダミー特徴量(yes or no)として変換する
mush_data_dummy = pd.get_dummies(
    mush_data[['gill_color', 'gill_attachment', 'odor', 'cap_color']])
# 目的変数:flg立てをする
mush_data_dummy["flg"] = mush_data["classes"].map(
    lambda x: 1 if x == 'p' else 0)
 
# 説明変数と目的変数
X = mush_data_dummy.drop("flg", axis=1)
Y = mush_data_dummy['flg']
 
# 学習データとテストデータに分ける
train_X, test_X, train_y, test_y = train_test_split(X,Y, random_state=42)
 
# 以下にコードを記述してください。
# モデルの読み込み
from sklearn.tree import DecisionTreeClassifier
from sklearn.ensemble import RandomForestClassifier
 
# モデルの構築
model1 = RandomForestClassifier()
model2 = DecisionTreeClassifier()
# モデルの学習
model1.fit(train_X, train_y)
model2.fit(train_X, train_y)
 
# 正解率を算出
print(model1.score(test_X, test_y))
print(model2.score(test_X, test_y))


Filed Under: Python 基本

不要なデータを削除する flag,dummy,drop

2017年12月13日 by 河副 太智 Leave a Comment

1
2
3
4
5
6
7
8
9
10
11
12
13
14
15
16
17
18
19
20
21
22
23
24
25
26
# url
mush_data_url = "http://archive.ics.uci.edu/ml/machine-learning-databases/mushroom/agaricus-lepiota.data"
s = requests.get(mush_data_url).content
 
# データの形式変換
mush_data = pd.read_csv(io.StringIO(s.decode('utf-8')), header=None)
 
# データに名前をつける(データを扱いやすくするため)
mush_data.columns = ["classes", "cap_shape", "cap_surface", "cap_color", "odor", "bruises",
                     "gill_attachment", "gill_spacing", "gill_size", "gill_color", "stalk_shape",
                     "stalk_root", "stalk_surface_above_ring", "stalk_surface_below_ring",
                     "stalk_color_above_ring", "stalk_color_below_ring", "veil_type", "veil_color",
                     "ring_number", "ring_type", "spore_print_color", "population", "habitat"]
 
# カテゴリー変数(色の種類など数字の大小が決められないもの)をダミー特徴量(yes or no)として変換する
mush_data_dummy = pd.get_dummies(
    mush_data[['gill_color', 'gill_attachment', 'odor', 'cap_color']])
 
print(mush_data)
# 目的変数:flg立てをする
mush_data_dummy["flg"] = mush_data["classes"].map(
    lambda x: 1 if x == 'p' else 0)
 
# 説明変数と目的変数
X = mush_data_dummy.drop("flg", axis=1)
Y = mush_data_dummy['flg']


Filed Under: データクレンジング Tagged With: flg, ダミー, ダミー特徴量, ノイズ, ノイズ除去, 不要, 不要データ, 例外, 分別, 削除, 省く, 省略

決定木 hs分類に使えそう

2017年12月13日 by 河副 太智 Leave a Comment

画像検索結果


決定木はこれまで紹介したロジスティック回帰やSVMとは違い、データの要素(説明変数)の一つ一つに着目し、その要素内でのある値を境にデータを分割していくことでデータの属するクラスを決定しようとする手法です。

決定木では説明変数の一つ一つが目的変数にどのくらいの影響を与えているのかを見ることができます。
分割を繰り返すことで枝分かれしていきますが、先に分割される変数ほど影響力が大きいと捉えることができます。

欠点は線形分離可能なデータは苦手であることと、学習が教師データに寄りすぎる(汎化されない)ことです。


1
2
3
4
5
6
7
8
9
10
11
12
13
14
15
16
17
18
19
20
21
22
23
24
25
26
27
28
29
30
31
32
33
34
35
36
37
38
39
40
41
42
43
44
45
46
47
48
49
50
# きのこデータの取得
# 必要なパッケージをインポート
import requests
import zipfile
from io import StringIO
import io
import pandas as pd
# データの前処理に必要なパッケージのインポート
from sklearn.model_selection import train_test_split
from sklearn import preprocessing
 
# url
mush_data_url = "http://archive.ics.uci.edu/ml/machine-learning-databases/mushroom/agaricus-lepiota.data"
s = requests.get(mush_data_url).content
 
# データの形式変換
mush_data = pd.read_csv(io.StringIO(s.decode('utf-8')), header=None)
 
# データに名前をつける(データを扱いやすくするため)
mush_data.columns = ["classes", "cap_shape", "cap_surface", "cap_color", "odor", "bruises",
                     "gill_attachment", "gill_spacing", "gill_size", "gill_color", "stalk_shape",
                     "stalk_root", "stalk_surface_above_ring", "stalk_surface_below_ring",
                     "stalk_color_above_ring", "stalk_color_below_ring", "veil_type", "veil_color",
                     "ring_number", "ring_type", "spore_print_color", "population", "habitat"]
 
# カテゴリー変数(色の種類など数字の大小が決められないもの)をダミー特徴量(yes or no)として変換する
mush_data_dummy = pd.get_dummies(
    mush_data[['gill_color', 'gill_attachment', 'odor', 'cap_color']])
# 目的変数:flg立てをする
mush_data_dummy["flg"] = mush_data["classes"].map(
    lambda x: 1 if x == 'p' else 0)
 
# 説明変数と目的変数
X = mush_data_dummy.drop("flg", axis=1)
Y = mush_data_dummy['flg']
 
# 学習データとテストデータに分ける
train_X, test_X, train_y, test_y = train_test_split(X,Y, random_state=42)
 
# 以下にコードを記述してください。
# モデルの読み込み
from sklearn.tree import DecisionTreeClassifier
 
# モデルの構築
model = DecisionTreeClassifier()
# モデルの学習
model.fit(train_X, train_y)
 
# 正解率を算出
print(model.score(test_X, test_y))


Filed Under: 機械学習

非線形svm カーネル関数

2017年12月13日 by 河副 太智 Leave a Comment

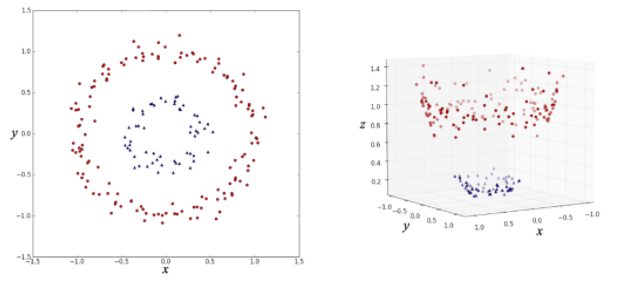
左側の (x, y) 平面上の点を分類する場合、
このままだと線形分類器(直線で分類するアルゴリズム)ではうまく分類できないのが、
右図のように z 軸を追加してデータを変形すると、
平面できれいに分割できるようになって、線形分類器による分類がうまくいくというものです。
このように、高次元空間にデータを埋め込むことでうまいこと分類するのが
カーネル法の仕組みだというわけです。


svc = サポートベクターマシン


1
2
3
4
5
6
7
8
9
10
11
12
13
14
15
16
17
18
19
20
21
22
from sklearn.svm import LinearSVC
from sklearn.svm import SVC
from sklearn.model_selection import train_test_split
from sklearn.datasets import make_gaussian_quantiles
 
# データの生成
X, y = make_gaussian_quantiles(
    n_samples=1000, n_classes=2, n_features=2, random_state=42)
train_X, test_X, train_y, test_y = train_test_split(X, y, random_state=42)
 
# 以下にコードを記述してください
# モデルの構築
model1 = SVC(random_state=42)
model2 = LinearSVC(random_state=42)#これは線形
 
# train_Xとtrain_yを使ってモデルに学習させる
model1.fit(train_X, train_y)
model2.fit(train_X, train_y)
 
# test_Xに対するモデルの分類予測結果
print("非線形SVM: {}".format(model1.score(test_X, test_y)))
print("線形SVM: {}".format(model2.score(test_X, test_y)))


Filed Under: グラフ, 機械学習 Tagged With: サポートベクターマシン

線形svm

2017年12月13日 by 河副 太智 Leave a Comment

1
2
3
4
5
6
7
8
9
10
11
12
13
14
15
16
17
18
19
20
21
22
23
24
25
26
27
28
29
30
31
32
33
34
35
36
37
38
39
40
41
42
43
44
45
# パッケージをインポート
import numpy as np
import matplotlib
import matplotlib.pyplot as plt
from sklearn.svm import LinearSVC
from sklearn.model_selection import train_test_split
from sklearn.datasets import make_classification
# ページ上で直接グラフが見られるようにするおまじない
%matplotlib inline
 
 
# データの生成
X, y = make_classification(n_samples=100, n_features=2,
                           n_redundant=0, random_state=42)
train_X, test_X, train_y, test_y = train_test_split(X, y, random_state=42)
 
# 以下にコードを記述してください
# モデルの構築
model = LinearSVC(random_state=42)
 
# train_Xとtrain_yを使ってモデルに学習させる
model.fit(train_X, train_y)
 
# test_Xとtest_yを用いたモデルの正解率を出力
print(model.score(test_X, test_y))
 
# 生成したデータをプロット
plt.scatter(X[:, 0], X[:, 1], c=y, marker='.',
            cmap=matplotlib.cm.get_cmap(name='bwr'), alpha=0.7)
 
# 学習して導出した識別境界線をプロット
Xi = np.linspace(-10, 10)
Y = -model.coef_[0][0] / model.coef_[0][1] * Xi - model.intercept_ / model.coef_[0][1]
plt.plot(Xi, Y)
 
# グラフのスケールを調整
plt.xlim(min(X[:, 0]) - 0.5, max(X[:, 0]) + 0.5)
plt.ylim(min(X[:, 1]) - 0.5, max(X[:, 1]) + 0.5)
plt.axes().set_aspect('equal', 'datalim')
# グラフにタイトルを設定する
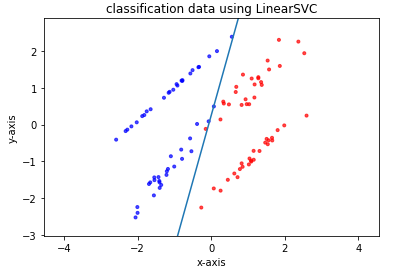
plt.title("classification data using LinearSVC")
# x軸、y軸それぞれに名前を設定する
plt.xlabel("x-axis")
plt.ylabel("y-axis")
plt.show()


Filed Under: グラフ, 機械学習

データを分割(教師あり)

2017年12月13日 by 河副 太智 Leave a Comment

データセットの全てを使って学習テストをしては意味がない

train_test_split 関数を使ってデータを分割
train_test_split 関数はデータをランダムに、指定割合で分割できる

X_train: トレーニング用の特徴行列(「アルコール度数」「密度」「クエン酸」などのデータ)
X_test: テスト用の特徴行列
y_train: トレーニング用の目的変数(「美味しいワイン」か「そうでもないワインか」)
y_test: テスト用の目的変数
train_test_split には以下のような引数を与える

第一引数: 特徴行列 X
第二引数: 目的変数 y
test_size=: テスト用のデータを何割の大きさにするか
test_size=0.3 で、3割をテスト用のデータとして置いておけます
random_state=: データを分割する際の乱数のシード値
同じ結果が返るように 0 を指定、これは勉強用であり普段は指定しない

1
2
3
4
5
from sklearn.model_selection import train_test_split
(X_train, X_test,
y_train, y_test) = train_test_split(
    X, y, test_size=0.3, random_state=0,#Xとyには既にデータセットが代入されている
)


その他の分割方法

①学習データとターゲットデータがきれいに分割されている場合

1
2
3
from sklearn.model_selection importtrain_test_split
X_train,X_test,y_train,y_test = train_test_split(
    iris_dataset["data"],iris_dataset["target"],random_state=0)

②データフレームに複数のカラムがあり、そのうち一つのカラムをターゲットにする場合

1
2
3
4
5
train_X = df.drop('Survived', axis=1)#ターゲット変数以外を学習データとしてtrain_Xへ
train_y = df.Survived #ターゲット変数のカラムのみをtrain_yへ
 
#更にtrain_X, train_yをtest_X,test_yに7:3で分割する
(train_X, test_X ,train_y, test_y) = train_test_split(train_X, train_y, test_size = 0.3, random_state = 666)


Filed Under: 教師有り, 機械学習

  • « Go to Previous Page
  • Page 1
  • Interim pages omitted …
  • Page 27
  • Page 28
  • Page 29
  • Page 30
  • Page 31
  • Interim pages omitted …
  • Page 55
  • Go to Next Page »

Primary Sidebar

カテゴリー

  • AWS
  • Bootstrap
  • Dash
  • Django
  • flask
  • GIT(sourcetree)
  • Plotly/Dash
  • VPS
  • その他tool
  • ブログ
  • プログラミング
    • Bokeh
    • css
    • HoloViews
    • Jupyter
    • Numpy
    • Pandas
    • PosgreSQL
    • Python 基本
    • python3
      • webアプリ
    • python3解説
    • scikit-learn
    • scipy
    • vps
    • Wordpress
    • グラフ
    • コマンド
    • スクレイピング
    • チートシート
    • データクレンジング
    • ブロックチェーン
    • 作成実績
    • 時系列分析
    • 機械学習
      • 分析手法
      • 教師有り
    • 異常値検知
    • 自然言語処理
  • 一太郎
  • 数学
    • sympy
      • 対数関数(log)
      • 累乗根(n乗根)
    • 暗号学

Copyright © 2025 · Genesis Sample on Genesis Framework · WordPress · Log in