• Skip to main content
  • Skip to primary sidebar

学習記録

プログラミング

棒グラフ、ヒストグラム

2017年12月6日 by 河副 太智 Leave a Comment

1
2
3
4
5
6
7
8
9
10
11
import numpy as np
import matplotlib.pyplot as plt
%matplotlib inline
 
 
np.random.seed(0)
data = np.random.randn(10000)
 
# 正規化されたビン数100のヒストグラムを作成
plt.hist(data, bins=100, normed=True)
plt.show()


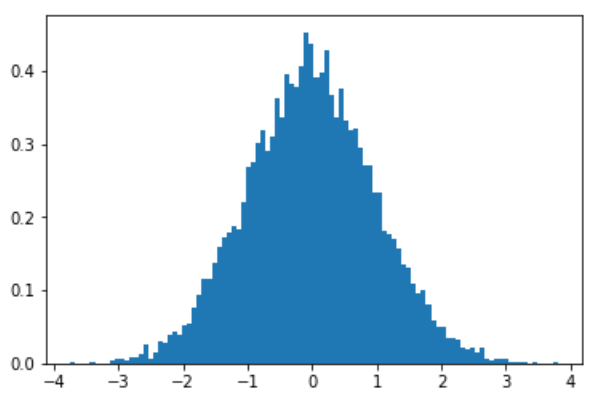
bins=xで任意の数の階級に分け、autoはランダム
normedは正規化
cumulativeは累積ヒストグラム


Filed Under: グラフ

Jupyterでzip等圧縮ファイル解凍

2017年12月5日 by 河副 太智 Leave a Comment

JupyterのNewからPython3を選択

Jupyter上で解凍
1
2
3
import zipfile
with zipfile.ZipFile("スクレイピング.zip","r") as zip_ref:
    zip_ref.extractall("")


Filed Under: Python 基本 Tagged With: Jupyter

線グラフ

2017年12月5日 by 河副 太智 Leave a Comment

グラフのプロット

1
2
3
4
5
6
7
8
9
10
11
12
import matplotlib.pyplot as plt
import numpy as np
# jupyterてグラフを表示する
%matplotlib inline
 
 
x = np.linspace(0, np.pi)
y = np.sin(x)
 
# データx,yをグラフにプロット
plt.plot(x,y)
plt.show()


線グラフの表示方法
1
2
3
4
5
6
7
8
9
10
11
12
13
14
15
import numpy as np
import matplotlib.pyplot as plt
%matplotlib inline
 
 
days = np.arange(1, 11)
weight = np.array([10, 14, 18, 20, 18, 16, 17, 18, 20, 17])
# 表示の設定
plt.ylim([0, weight.max()+1])
plt.xlabel("days")
plt.ylabel("weight")
 
# 円マーカーを赤色でプロットし、青の破線の折れ線グラフを作成
plt.plot(days, weight, linestyle="--", color="b", marker="o", markerfacecolor="r")
plt.show()


マーカー (,marker=”o”)

  • "o": 円
  • "s": 四角
  • "p": 五角形
  • "*": 星
  • "+": プラス
  • "D": ダイアモンド

色 (markerfacecolor=”r”)

  • "b" : 青
  • "g" : 緑
  • "r" : 赤
  • "c" : シアン
  • "m" : マゼンタ
  • "y" : 黄色
  • "k" : 黒
  • "w" : 白

線のスタイル  (linestyle=”–“)

  • "-": 実線
  • "--": 破線
  • "-.": 破線(点入り)
  • ":": 点線

Filed Under: グラフ

split()でデータフレームを任意の文字列で分割

2017年12月5日 by 河副 太智 Leave a Comment

データフレームのカラムのcol1にa,bを交互に7個づつ振る

groupbyを実行する
1
2
3
4
5
6
7
8
9
10
11
12
13
14
15
16
17
18
19
20
21
22
23
24
25
26
import pandas as pd
import datetime
 
 
df = pd.DataFrame({'dt1': [datetime.datetime(2014, 10, 1),
                           datetime.datetime(2014, 10, 2),
                           datetime.datetime(2014, 10, 3),
                           datetime.datetime(2014, 10, 4),
                           datetime.datetime(2014, 10, 5),
                           datetime.datetime(2014, 10, 6),
                           datetime.datetime(2014, 10, 7),
                           datetime.datetime(2014, 11, 1),
                           datetime.datetime(2014, 11, 2),
                           datetime.datetime(2014, 11, 3),
                           datetime.datetime(2014, 11, 4),
                           datetime.datetime(2014, 11, 5),
                           datetime.datetime(2014, 11, 6),
                           datetime.datetime(2014, 11, 7)],
                   'col1': 'a b'.split() * 7})
print(df)
 
x = df.groupby('col1').groups
 
print(x)
 
print (len((x["b"])))


結果
1
2
3
4
5
6
7
8
9
10
11
12
13
14
15
16
17
   col1        dt1
0     a 2014-10-01
1     b 2014-10-02
2     a 2014-10-03
3     b 2014-10-04
4     a 2014-10-05
5     b 2014-10-06
6     a 2014-10-07
7     b 2014-11-01
8     a 2014-11-02
9     b 2014-11-03
10    a 2014-11-04
11    b 2014-11-05
12    a 2014-11-06
13    b 2014-11-07
{'b': Int64Index([1, 3, 5, 7, 9, 11, 13], dtype='int64'), 'a': Int64Index([0, 2, 4, 6, 8, 10, 12], dtype='int64')}
7

x = df.groupby(‘col1’).groups

でcol1をベースとしたグループ分けされたリストを渡し、


print (len(x[“b”])
bにグループ分けされたものの個数だけ表示

Filed Under: Pandas

groupby()でベースを決めてグループ分け

2017年12月5日 by 河副 太智 Leave a Comment

データフレームのカラムのcol1にa,bを交互に振っていき
それをaとbのグループ分けにgroupby()を使用する。

groupbyを実行する
1
2
3
4
5
6
7
8
9
10
11
12
13
14
15
16
17
18
19
20
21
22
23
24
25
26
import pandas as pd
import datetime
 
 
df = pd.DataFrame({'dt1': [datetime.datetime(2014, 10, 1),
                           datetime.datetime(2014, 10, 2),
                           datetime.datetime(2014, 10, 3),
                           datetime.datetime(2014, 10, 4),
                           datetime.datetime(2014, 10, 5),
                           datetime.datetime(2014, 10, 6),
                           datetime.datetime(2014, 10, 7),
                           datetime.datetime(2014, 11, 1),
                           datetime.datetime(2014, 11, 2),
                           datetime.datetime(2014, 11, 3),
                           datetime.datetime(2014, 11, 4),
                           datetime.datetime(2014, 11, 5),
                           datetime.datetime(2014, 11, 6),
                           datetime.datetime(2014, 11, 7)],
                   'col1': 'a b'.split() * 7})
print(df)
 
x = df.groupby('col1').groups
 
print(x)
 
print (len((x["b"])))


結果
1
2
3
4
5
6
7
8
9
10
11
12
13
14
15
16
17
   col1        dt1
0     a 2014-10-01
1     b 2014-10-02
2     a 2014-10-03
3     b 2014-10-04
4     a 2014-10-05
5     b 2014-10-06
6     a 2014-10-07
7     b 2014-11-01
8     a 2014-11-02
9     b 2014-11-03
10    a 2014-11-04
11    b 2014-11-05
12    a 2014-11-06
13    b 2014-11-07
{'b': Int64Index([1, 3, 5, 7, 9, 11, 13], dtype='int64'), 'a': Int64Index([0, 2, 4, 6, 8, 10, 12], dtype='int64')}
7

x = df.groupby(‘col1’).groups

でcol1をベースとしたグループ分けされたリストを渡し、


print (len(x[“b”])
bにグループ分けされたものの個数だけ表示

Filed Under: Pandas

Seriesできること

2017年12月3日 by 河副 太智 Leave a Comment

1
import pandas as pd

​
■通常の辞書

1
2
3
<span class="cm-variable">fruits</span> = {<span class="cm-string">"banana"</span>: <span class="cm-number">3</span>, <span class="cm-string">"orange"</span>: <span class="cm-number">2</span>}
<span class="cm-builtin">print</span>(<span class="cm-variable">pd</span>.<span class="cm-property">Series</span>(<span class="cm-variable">fruits</span>))
 

>>>
banana 3
orange 2
dtype: int64

■辞書どうしの結合

1
2
3
4
<span role="presentation">index = ["cup", "chair", "table", "kagaku", "pictre"]
data = [7012, 9406, 9609, 3824,9701]
 
</span>

1
<span role="presentation"><span class="cm-variable">series</span> = <span class="cm-variable">pd</span>.<span class="cm-property">Series</span>(<span class="cm-variable">data</span>, <span class="cm-variable">index</span>=<span class="cm-variable">index</span>)</span>

1
<span role="presentation">​</span>print(<span class="cm-variable">series</span>)&gt;&gt;&gt;

1
2
3
4
5
6
cup       7012
chair     9406
table     9609
kagaku    3824
pictre    9701
dtype: int64

■条件抽出 フィルタリング

1
<span role="presentation"><span class="cm-comment"># series内の要素のうち、値が5以上10未満の要素を含むSeriesを作り、seriesに再代入</span></span>

1
<span role="presentation"><span class="cm-variable">series</span> = <span class="cm-variable">series</span>[<span class="cm-variable">series</span> <span class="cm-operator">&gt;</span>= <span class="cm-number">5</span>][<span class="cm-variable">series</span> <span class="cm-operator">&lt;</span> <span class="cm-number">10</span>]</span>

1
<span role="presentation">​</span><span role="presentation"><span class="cm-builtin">print</span><span class=" CodeMirror-matchingbracket">(</span><span class="cm-variable">series</span><span class=" CodeMirror-matchingbracket">)</span></span>

■インデックス参照,key,キーから取得

1
2
3
4
5
<span role="presentation"><span class="cm-comment"># seriesの2から4までの3つをitems1に代入
 
index = ["apple", "orange", "banana", "strawberry", "kiwifruit"]
data = [10, 5, 8, 12, 3]
series = pd.Series(data, index=index)</span></span>

items1 = series[1:4] 結果 orange 5 banana 8 strawberry 12 dtype: int64

■値,value,キーワードから取得

index = [“apple”, “orange”, “banana”, “strawberry”, “kiwifruit”]
data = [10, 5, 8, 12, 3]
series = pd.Series(data, index=index)

1
<span role="presentation"><span class="cm-variable">items2</span>=<span class="cm-variable">series</span>[[<span class="cm-string">"apple"</span>,<span class="cm-string">"banana"</span>,<span class="cm-string">"kiwifruit"</span>]]</span>

1
<span role="presentation">​</span>

1
結果

apple 10
banana 8
kiwifruit 3
dtype: int64

■ソート

index = [“a”, “b”, “c”, “d”, “e”]
data = [10, 5, 8, 12, 3]
series = pd.Series(data, index=index)

# seriesをインデックスに基づいてアルファベット順にソートしたSeriesをitems1に代入
items1 = series.sort_index()

# seriesをデータについて値の大きさを昇順にソートしたSeriesをitems2に代入
items2 = series.sort_values()

Filed Under: Pandas

  • « Go to Previous Page
  • Page 1
  • Interim pages omitted …
  • Page 30
  • Page 31
  • Page 32
  • Page 33
  • Page 34
  • Interim pages omitted …
  • Page 55
  • Go to Next Page »

Primary Sidebar

カテゴリー

  • AWS
  • Bootstrap
  • Dash
  • Django
  • flask
  • GIT(sourcetree)
  • Plotly/Dash
  • VPS
  • その他tool
  • ブログ
  • プログラミング
    • Bokeh
    • css
    • HoloViews
    • Jupyter
    • Numpy
    • Pandas
    • PosgreSQL
    • Python 基本
    • python3
      • webアプリ
    • python3解説
    • scikit-learn
    • scipy
    • vps
    • Wordpress
    • グラフ
    • コマンド
    • スクレイピング
    • チートシート
    • データクレンジング
    • ブロックチェーン
    • 作成実績
    • 時系列分析
    • 機械学習
      • 分析手法
      • 教師有り
    • 異常値検知
    • 自然言語処理
  • 一太郎
  • 数学
    • sympy
      • 対数関数(log)
      • 累乗根(n乗根)
    • 暗号学

Copyright © 2025 · Genesis Sample on Genesis Framework · WordPress · Log in