• Skip to main content
  • Skip to primary sidebar

学習記録

csvからbokehグラフ出力

2018年5月29日 by 河副 太智 Leave a Comment

csvファイルから表示したいデータのカラムを指定する。


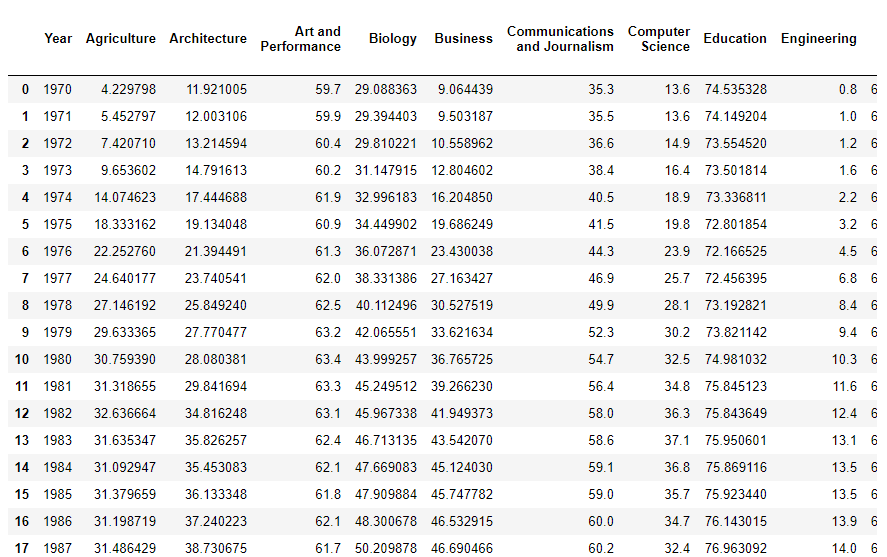
今回はYearとEngineeringのデータだけを指定


1
2
3
df=pandas.read_csv("bachelors.csv")
x = df["Year"]
y = df["Engineering"]


コード全体

1
2
3
4
5
6
7
8
9
10
11
12
13
14
15
16
17
18
19
20
21
22
23
#Making a basic Bokeh line graph
 
#importing bokeh and pandas
from bokeh.plotting import figure
from bokeh.io import output_file, show
import pandas
 
#prepare some data
df=pandas.read_csv("bachelors.csv")
x = df["Year"]
y = df["Engineering"]
 
# #prepare the output file
output_file("aaa.html")
 
# #create a figure object
f = figure()
dir(f)
#create line plot
f.line(x,y)
 
#write the plot in the figure object
show(f)


実行結果


※HTMLファイルを出力した後にコードの内容を変更して
再度HTMLファイルを生成すると元のコードに上書きされず、
二重にコードが書かれてHTML出力してしまうバグがあります。

その結果上記コードを実行する度にHTMLファイルの容量は重くなっていきますので
対処法として最後のコードのshow()は使わずにsave()で実行すれば
HTMLファイルが重くなる現象を防ぐことができます。

このエントリーをはてなブックマークに追加

Tweet
[`yahoo` not found]
このエントリーを Google ブックマーク に追加
LinkedIn にシェア
LINEで送る


Filed Under: Bokeh

Reader Interactions

コメントを残す コメントをキャンセル

メールアドレスが公開されることはありません。 ※ が付いている欄は必須項目です

Primary Sidebar

カテゴリー

  • AWS
  • Bootstrap
  • Dash
  • Django
  • flask
  • GIT(sourcetree)
  • Plotly/Dash
  • VPS
  • その他tool
  • ブログ
  • プログラミング
    • Bokeh
    • css
    • HoloViews
    • Jupyter
    • Numpy
    • Pandas
    • PosgreSQL
    • Python 基本
    • python3
      • webアプリ
    • python3解説
    • scikit-learn
    • scipy
    • vps
    • Wordpress
    • グラフ
    • コマンド
    • スクレイピング
    • チートシート
    • データクレンジング
    • ブロックチェーン
    • 作成実績
    • 時系列分析
    • 機械学習
      • 分析手法
      • 教師有り
    • 異常値検知
    • 自然言語処理
  • 一太郎
  • 数学
    • sympy
      • 対数関数(log)
      • 累乗根(n乗根)
    • 暗号学

Copyright © 2025 · Genesis Sample on Genesis Framework · WordPress · Log in