Dashを使用してローカル環境でのwebappの構築
以下のコードを実行するとポート8050で実行される
Running on http://1xx.0.0.1:8050/
|
1 2 3 4 5 6 7 8 9 10 11 12 13 14 15 16 17 18 19 20 21 22 23 24 25 26 |
import dash import dash_core_components as dcc import dash_html_components as html app = dash.Dash() app.layout = html.Div(children=[ html.H1(children='Hello Dash'), html.Div(children='Dash: A web application framework for Python.'), dcc.Graph( id='example-graph', figure={ 'data': [ {'x': [1, 2, 3], 'y': [4, 1, 2], 'type': 'bar', 'name': 'SF'}, {'x': [1, 2, 3], 'y': [2, 4, 5], 'type': 'bar', 'name': u'Montréal'}, ], 'layout': { 'title': 'Dash Data Visualization' } } ) ]) if __name__ == '__main__': app.run_server() |
上記コードは値を手入力で入れているので次はplotlyを使用して
グラフを表示させます。
|
1 2 3 4 5 6 7 8 9 10 11 12 13 14 15 16 17 18 19 20 21 |
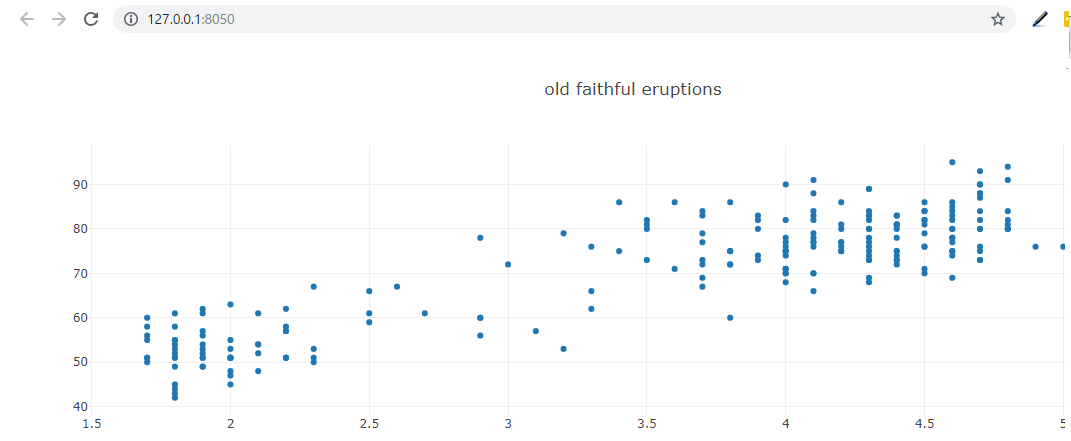
# -*- coding: utf-8 -*- import dash import dash_core_components as dcc import dash_html_components as html import plotly.graph_objs as go import pandas as pd df = pd.read_csv("OldFaithful.csv") app = dash.Dash() app.layout = html.Div([dcc.Graph(id="old", figure={"data":[go.Scatter(x=df["X"],y=df["Y"],mode="markers")], "layout":go.Layout(title="old faithful eruptions", xaxis={"title":"Duration"}, yaxis={"title":"Interval"})})]) if __name__ == '__main__': app.run_server() |
↓ローカル上で表示されたWebapp

コメントを残す