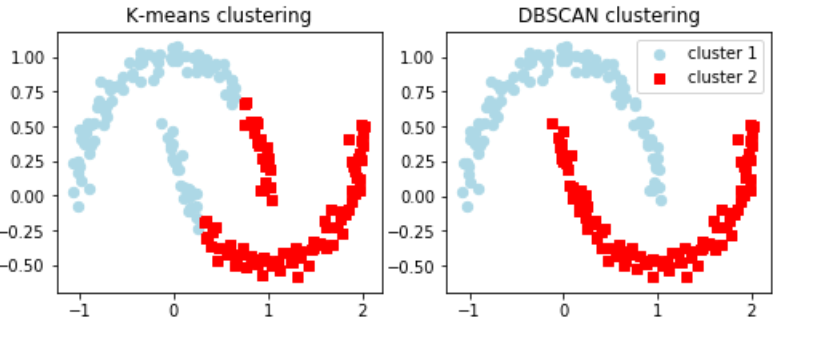
k-means法は複雑で大小の偏りがある場合はよいクラスタリングができない事がある
これに対しクラスタリングのアルゴリズムにDBSCANがあり
クラスターを高密度(データが凝集している)の場所を低密度の場所から分離して表示
k-means法は、クラスターの大きさに均等で平坦な場合は有効だが
DBSCANは対照的に、平坦ではないデータやクラスターサイズに偏りがある際に真価を発揮する
|
1 2 3 4 5 6 7 8 9 10 11 12 13 14 15 16 17 18 19 20 21 22 23 24 25 26 27 28 29 30 31 32 33 34 35 36 37 38 39 40 41 42 43 44 45 46 47 48 49 50 |
import matplotlib.pyplot as plt import numpy as np from sklearn.datasets import make_moons from sklearn.cluster import KMeans from sklearn.cluster import DBSCAN # 月型のデータを生成 X, y = make_moons(n_samples=200, noise=0.05, random_state=0) # グラフと2つの軸を定義 左はk-means法用、右はDBSCAN用 f, (ax1, ax2) = plt.subplots(1, 2, figsize=(8,3)) km = KMeans(n_clusters=2, random_state=0) y_km = km.fit_predict(X) ax1.scatter(X[y_km==0, 0], X[y_km==0, 1], c='lightblue', marker='o', s=40, label='cluster 1') ax1.scatter(X[y_km==1, 0], X[y_km==1, 1], c='red', marker='s', s=40, label='cluster 2') ax1.set_title('K-means clustering') # DBSCAN用のインスタンスを生成 # XをDBSCANでクラスタリング ax2.scatter(X[y_db==0, 0], X[y_db==0, 1], c='lightblue', marker='o', s=40, label='cluster 1') ax2.scatter(X[y_db==1, 0], X[y_db==1, 1], c='red', marker='s', s=40, label='cluster 2') ax2.set_title('DBSCAN clustering') plt.legend() plt.show() |

コメントを残す