ヒートマップを使用して複数のグラフを重ねる
tools.make_subplots
でrows=1, cols=3,と設定
shared_yaxes = True
でy軸の値を複数のグラフで共通で使用できる
次に各グラフの位置をappend_tradeで指定
先ほどのtools.make_subplotsでrows=1, cols=3,と設定したので
これに対応した位置指定をします。
fig.append_trace(trace1, 1, 1)
はtrace1のグラフを1行目の1列と指定(行は元々1しかない)
fig.append_trace(trace2, 1, 2)
はtrace2のグラフを1行目の2列と指定
fig.append_trace(trace3, 1, 3)
はtrace3のグラフを1行目の3列と指定
これでfigに3つのグラフが挿入された事になる
|
1 2 3 4 5 6 7 8 9 10 11 12 13 14 15 16 17 18 19 20 21 22 23 24 25 26 27 28 29 30 31 32 33 34 35 36 37 38 39 40 41 42 43 44 45 46 47 48 |
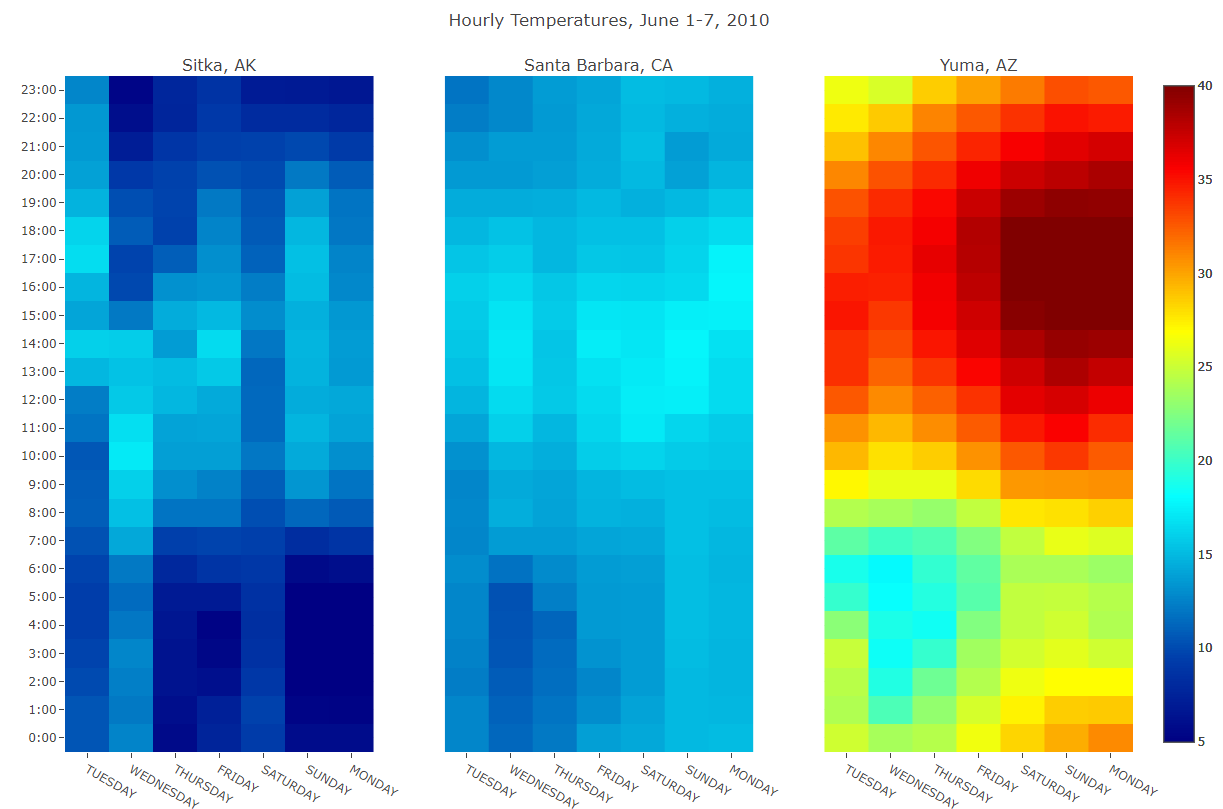
####### # Side-by-side heatmaps for Sitka, Alaska, # Santa Barbara, California and Yuma, Arizona # using a shared temperature scale. ###### import plotly.offline as pyo import plotly.graph_objs as go from plotly import tools import pandas as pd df1 = pd.read_csv('../data/2010SitkaAK.csv') df2 = pd.read_csv('../data/2010SantaBarbaraCA.csv') df3 = pd.read_csv('../data/2010YumaAZ.csv') trace1 = go.Heatmap( x=df1['DAY'], y=df1['LST_TIME'], z=df1['T_HR_AVG'], colorscale='Jet', zmin = 5, zmax = 40 # add max/min color values to make each plot consistent ) trace2 = go.Heatmap( x=df2['DAY'], y=df2['LST_TIME'], z=df2['T_HR_AVG'], colorscale='Jet', zmin = 5, zmax = 40 ) trace3 = go.Heatmap( x=df3['DAY'], y=df3['LST_TIME'], z=df3['T_HR_AVG'], colorscale='Jet', zmin = 5, zmax = 40 ) fig = tools.make_subplots(rows=1, cols=3, subplot_titles=('Sitka, AK','Santa Barbara, CA', 'Yuma, AZ'), shared_yaxes = True, # this makes the hours appear only on the left ) fig.append_trace(trace1, 1, 1) fig.append_trace(trace2, 1, 2) fig.append_trace(trace3, 1, 3) fig['layout'].update( # access the layout directly! title='Hourly Temperatures, June 1-7, 2010' ) pyo.plot(fig, filename='AllThree.html') |
コメントを残す